Dashboard
EZReports provides an intuitive dashboard to help administrators monitor essential afterschool program data. It covers different key performance indicators (KPIs) and metrics, such as student attendance, program quality, and academic performance. Administrators can use this data to make informed decisions and improve the overall operations of the afterschool program.
The following data points are covered in the dashboard:
- Program: State DOEs can leverage the state-level dashboard to gain an insightful overview of the afterschool program. The data encompasses quantifiable data and key metrics, such as grantees, sites, and grants (21CCLC and non-21CCLC), among others, crucial for the effective functioning of the program.
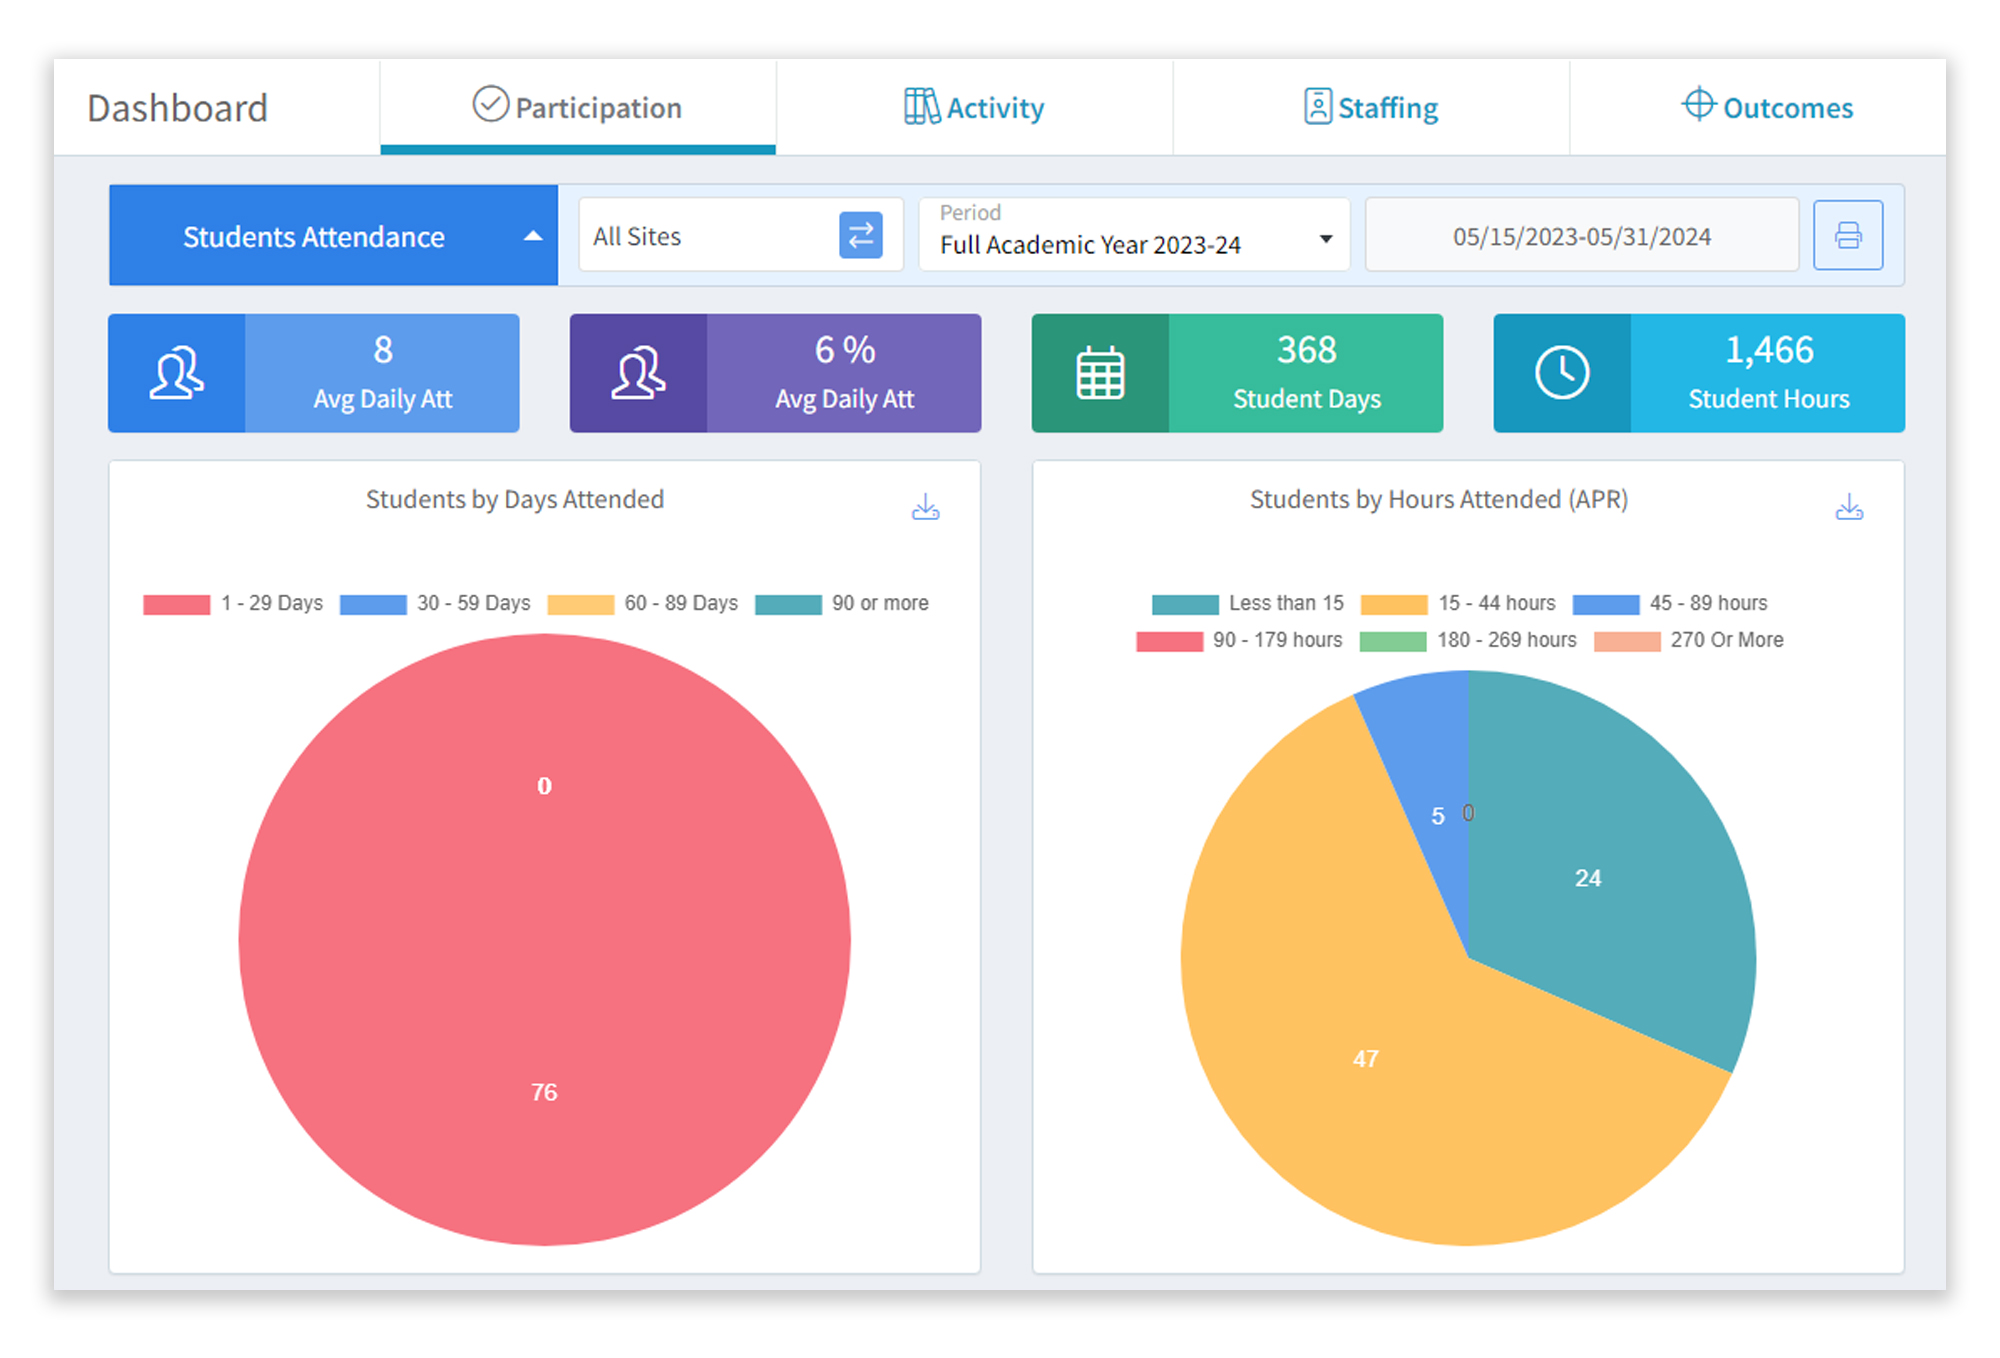
- Participation: Users can gauge the program participation patterns of both student and adult participants. Additionally, users can conduct a comparative analysis of student attendance across multiple sites.
- Activity: The dashboard provides a glimpse into the total number of activities, sessions, student enrollments, and program days by activity category.
- Staffing: Users can view the total number of staff by their demographics.
- Outcomes: Administrators can use the outcomes tool to track student performance by evaluating their grades in different grading periods.
Based on the dashboard analysis, administrators can modify operations to maximize their program's overall impact. For example, if a site is consistently recording low attendance, program administrators can look into the issue and work towards increasing student engagement and attendance. Similarly, if the outcomes tool shows poor student performance, additional resources can be allocated in the required focus areas to improve student learning.
Overall, the use of EZReports dashboards has helped our clients not only monitor their programs but also make data-driven decisions to optimize their program performance to meet grant objectives.